The climate alarmists are agog about the cold region in the north Atlantic, as evidence of a failing AMOC current. Now, I’m not an oceanographer, but I have discussed the science of thermal uptake here, and I should review the literature about the AMOC, but I was under the impression that weakening of the AMOC is real. Whether this cold blob indicates some greater failure of the circulation is the question. Of course, this is usually normal and expected, they don’t mention that. The question, again, is it normal? Let me get back to you on that.
Before I start on the boring stuff, namely, science, I want to note that I received a comment about my disparaging remark about ducks. Now, ducks are great, and just so important ecologically. So important. But I have to double down here and point out that ducks are dumb. They are birds and therefore have bird brains and thus are bird brains. Birds have a different sort of consciousness. And ducks are unfortunate creatures, with those bills stuck to their faces making them look ridiculous. I feel sorry for them, as they’ve apparently lost the reincarnation game and spend their lives eating algae with their feet wet, seeing predators everywhere. And the quacking. Sorry, not sorry, ducks.
Unfortunately, the impacts of climate change that we look at are too-often focused on things that affect us directly, like urban heating, sea level rise, flooding, and wildfires. All of which can be expected to become worse and have thus gotten tons of attention. Biodiversity is seemingly tacked onto the list of impacts as an afterthought because it’s worth considering, I suppose. Which kind of misses the point, as we are within a set of complex systems that are changing around us, recognizable firstly as ecosystem changes and their geographical distributions.
Environmental economics tries to quantify the economic value of ecological services, which are many and divided into several categories:
1. Provisioning services
a. Food. Keep in mind that fossil fuels are solar energy stored as chemical energy, which is what plants do.
b. Water, highly spatially variable in value.
c. Air, which rapidly increases in value when you can’t breathe
d. Raw materials
e. Medicinal resources
2. Regulating Services
a. Climate regulation
b. Water purification. This is really a big one, because vast areas of the oceans and rivers would be anoxic and dead without it.
c. Pollination. Agriculture without this is expensive and not applicable to many crops.
d. Erosion control. More important than you think, for communities and infrastructure.
3. Cultural Services
a. Recreation
b. Aesthetics
c. Cultural and historic heritage
4. Supporting Services
a. Nutrient cycling
b. Soil formation
c. Biodiversity maintenance
That’s a lot. And if we could properly fit each into project cost/benefit analysis we might spend our tax money differently. That’s the goal of environmental economics. Nature does what it does, which we largely ignore, and we take for granted the sun will shine and nature will keep doing its thing and fail to consider the value of these things.
Back to the subject. Let’s consider the impacts of climate change on ecosystems. We’ve entered the Anthropocene and these changes should eventually be dramatic. We should see changes in the physical distribution of organisms and entire habitats.
The Koppen-Geiger (sorry Deutschers, no umlaut because the last language keyboard extension I used caused financial damages and much embarrassment). This is the standard and designates the following five main groups (and subsets): tropical, arid, temperate, continental and polar, along with subgroups for a total of 31 types. Each is well-defined in terms of temperature and precipitation.
In an earlier post I posed the question of, “what do we know about observed changes in climate, consequent changes in ecosystem/habitats and what changes can we expect?”
I would point to one paper for starters:
Don’t read it, just load this explorer page:
This allows you to choose your emissions pathway for future periods and examine the changes. Still, it’s not easy to use and they should have overlays.
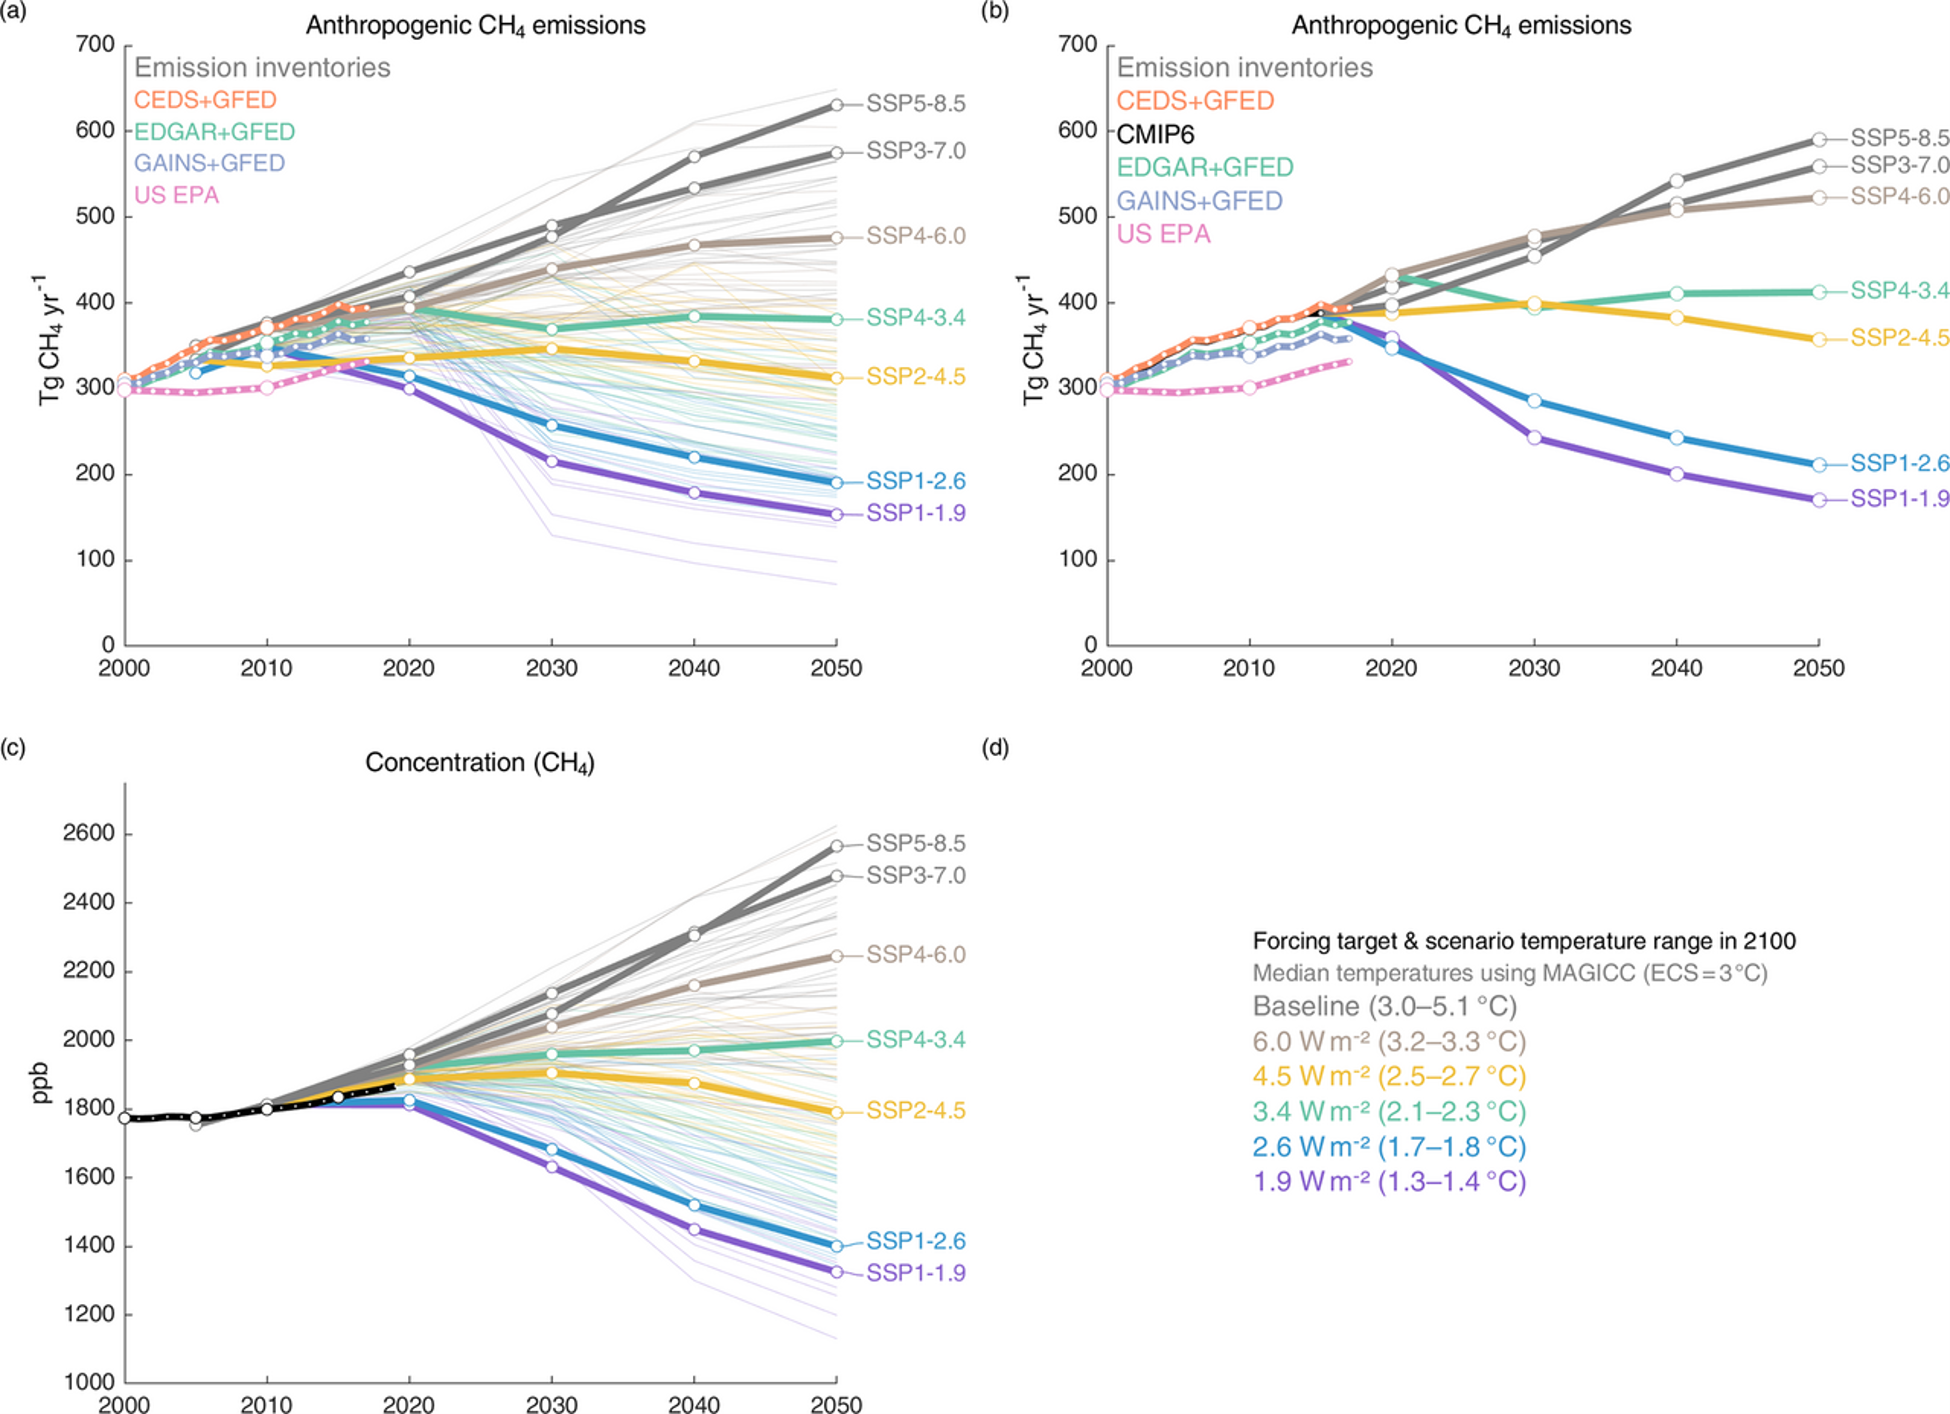
Unfortunately, SSP2-4.5 looks optimistic at this point, and is considered the middle-of-the-road scenario. So, let’s look at the changes forecast with this emissions scenario or Shared Socioeconomic Pathway (SSP):
A few key points:
“Based on the revised maps, we estimate that from 1901–1930 to 1991–2020, approximately 5% of the global land surface (excluding Antarctica) transitioned to a dfferent major Köppen-Geiger class.”
So changes are already obvious. Under the SSP-2-4.5 emissions scenario, the areal changes are estimated at 8% by 2099. The largest change is that from temperate climates to tropical climates, estimated at a total of 2.1M km2 or about 810,000 square miles. This is about three Texases.
Figure 7 of this work totals it up.
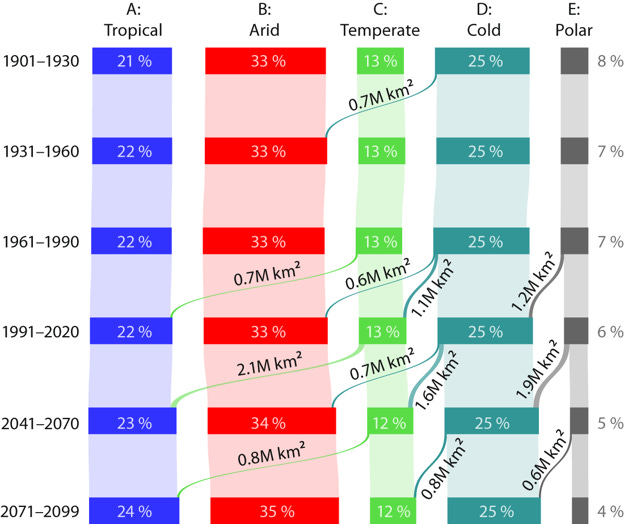
This is, again, under the SSP2-4.5 scenario. Tropical areas increase, as do arid areas, consistent with the trend described by Chandrapurkhar et al. (2025). But polar areas change the most, with the greatest aerial decrease by 2099.
Here are those emissions scenarios for reference:
But what does this change in climate designation actually look like?
Those shaded areas are the changes, mostly from one subgroup to another, but also in primary designation, from the 1901-1930 baseline through to 2099.
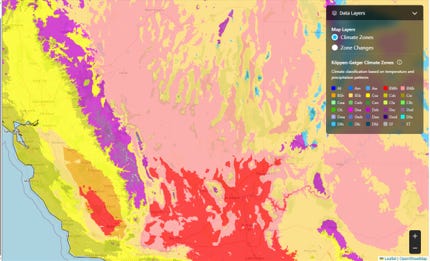
Since I’ve been talking about the American west so much, let’s look at part of that region. But this time let’s only go up to 2020, comparing again to the 1901-1930 baseline.
After:
Before:
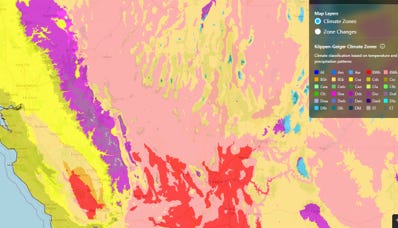
Note that dark brown blob (BWh – hot desert) in the Central Valley of California, the lighter red area to the north are designated Bsh (Hot Semi-Arid), dramatically increased in size, with Bsh areas replacing Bsk (Cold Semi-Aris) areas.
Cwa is a monsoon-influenced humid subtropical climate characterized by hot summers, mild winters, and a strong seasonal rainfall pattern.
Csb is characterized by mild, wet winters and dry, warm summers, typically found in coastal regions.
In the Great Basin desert Nevada is geologically known as the basin and range province, with north-south oriented mountain ranges that form habitat “islands” at higher elections.
If we look at just the changes in this area we see this pattern of outlines around these sky islands:
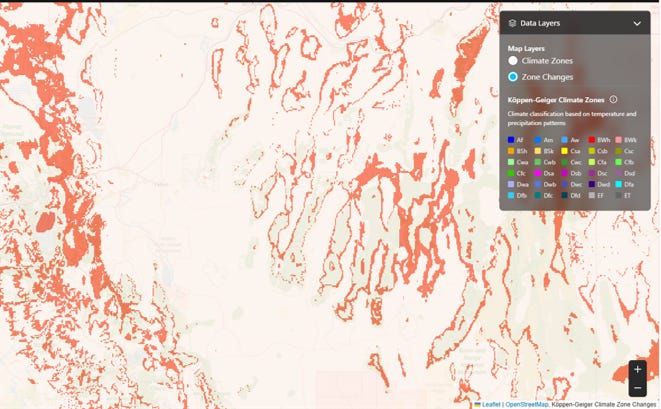
This shows the phenomenon of dryland desertification. As places become more arid, the desert moves up in elevation. This map is centered on Navada. The circumscribing red areas represent this change in habitat through elevational succession.
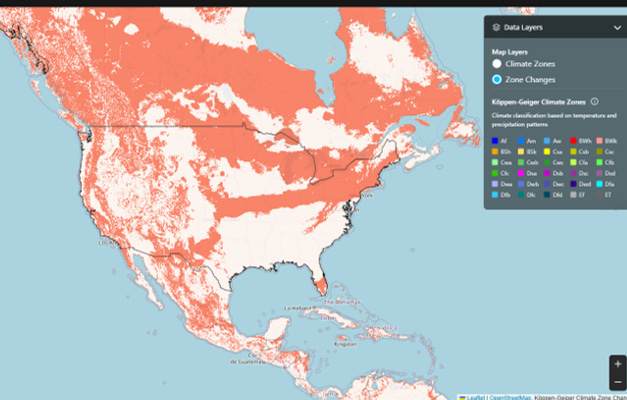
Next, look at the changes in arctic.
First, the before, the 1901-1930 baseline
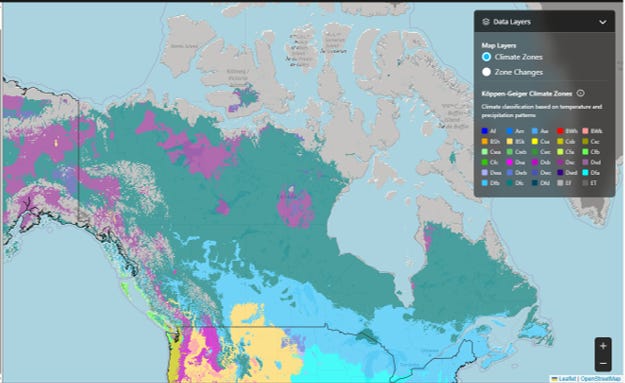
Next is the forecast changes to 2099.
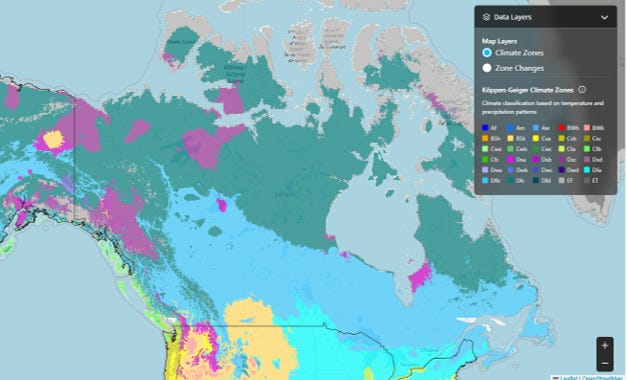
That’s a pretty dramatic change. The green areas, Dfc (subarctic) are being supplanted by Dfb (warm-summer humid continental). Like I’ve been saying, consider moving to Alberta, or Saskatchewan. Now, it’s easy to make flippant comments like that, but it really isn’t that simple. This is far enough north that the growing season is limited by the day length and besides, the frequency of precipitation is also expected to change. That said, some areas will gain arable land. This map also shows loss of permafrost, which is expected to release CO2 and methane, a positive feedback effect (positive in terms of thermodynamics, not meaning beneficial).
It’s also relevant that Alberta has taken actions to hamper renewable energy. As they’re much like Texas, with a strong oil and gas industry and a ranching tradition, their politics also appears to mirror that of Texas. For instance, the entity charged with regulation of the oil and gas industry, the Railroad Commission, states on their website that they are committed to deregulation.
Reference:
Beck, H.E., T.R. McVicar, N. Vergopolan, A. Berg, N.J. Lutsko, A. Dufour, Z. Zeng, X. Jiang, A.I.J.M. van Dijk, D.G. Miralles. High-resolution (1 km) Köppen-Geiger maps for 1901–2099 based on constrained CMIP6 projections, Scientific Data 10, 724, doi:10.1038/s41597-023–02549‑6 (2023).

Please leave a comment. I will respond.