Recent events and commentary.
There’s been a lot of chatter about 5-sigma weather events. 5 sigma means five standard deviations from the mean and implies that you’re assuming the distribution is random. It means about 3 in ten million in a normal (random) distribution.
If you see many 5-sigma events, it implies that your statistics are way off, or that the distribution isn’t random. We’re comfortable with weather being random, but in the systems theory perspective, changes to the inputs of a complex, chaotic system frequently change that system to new states, called a critical transition.
The 2022 and 2026 European heat waves were deadly. Several papers state that without human caused global warming these events would represent 4- or 5-sigma events. With global warming, they may become normal. Strictly speaking, we don’t have the baseline of weather data to state this. The point being that, without warming, they just wouldn’t happen.
Another “5-sigma event” might have been the 2022 collapse of the Conger–Glenzer Ice sheet in Antarctica, under normal conditions.
The term “5-sigma” might be triggering to some scientists, which may explain why it was chosen.
I hesitate to call some messengers “alarmists”, as if we should not be alarmed. But, the science is important. Consider, for instance, the recent glacier collapse in Nepal. These events certainly happen in the Himalayas, but glacial retreat is a global phenomenon caused by global warming. So, there is certainly some connection between global warming and the glacial collapse and subsequent flooding event. If blame must be placed, then, it would be pointed towards the two economies that have the largest total carbon emissions, China and the USA. This event may soon be considered normal, or, at least, a 3-sigma event.
We often talk of mean temperatures, and don’t really think about what it means. One issue is that the term implies randomness, Gaussian statistics, normality. But what mean temperature represents is the average state of the atmosphere at a single location, which is a sum of local differences and large scale dominant atmospheric circulation modes.
Western USA and reduced water vapor, soil moisture, evapotranspiration.
The main change that we’ve seen in north America is the weakening of the northwesterly cyclones, which typically bring precipitation to the western USA and Canada. This has allowed ridging to predominate and consequent heat waves.
Question: is this also responsible for the European heat waves?
Our expectation is that land warms more than ocean, as the oceans are vast heat sinks and are capable of taking up lots of excess heat. The atmosphere over the land is generally unbuffered by this heat sink.
Here in Houston the average daily mean temperatures have increased by about 2 degrees F, and the nighttime low mean temperatures have increased about 3 degrees F. As our weather’s dominant mode is flow off of the Gulf of Mexico, we are receiving air that is about the temperature of the Gulf itself, not considering daytime heating. Other places in the American West have seen their mean temperatures, especially nighttime lows, increase dramatically.
Two degrees doesn’t sound like much. But when it’s 83 degrees and humid at sunrise, it would make all the difference for soil moisture, as that much more water gets squeezed out of the air.
In Dallas, apparently, at least one person hates the heat so much that they awaken at 4:00am, before the dew falls, to mow the lawn, with a headlamp.
It’s fair to say that many Texans loathe the heat. Many of them grew up here but don’t go outside much. Now, I wouldn’t go so far as to say that Texans are all soft, but without air conditioning this place wouldn’t function for much of the year.
In recent posts I’ve looked at the connection between ENSO and warming in general. I also suggested that we’re seeing new patterns. That is, more tropical cyclone development outside of tropical areas.
This recent satellite loop, from a couple of weeks ago, of the tropical central/east Pacific ocean is consistent with this picture:
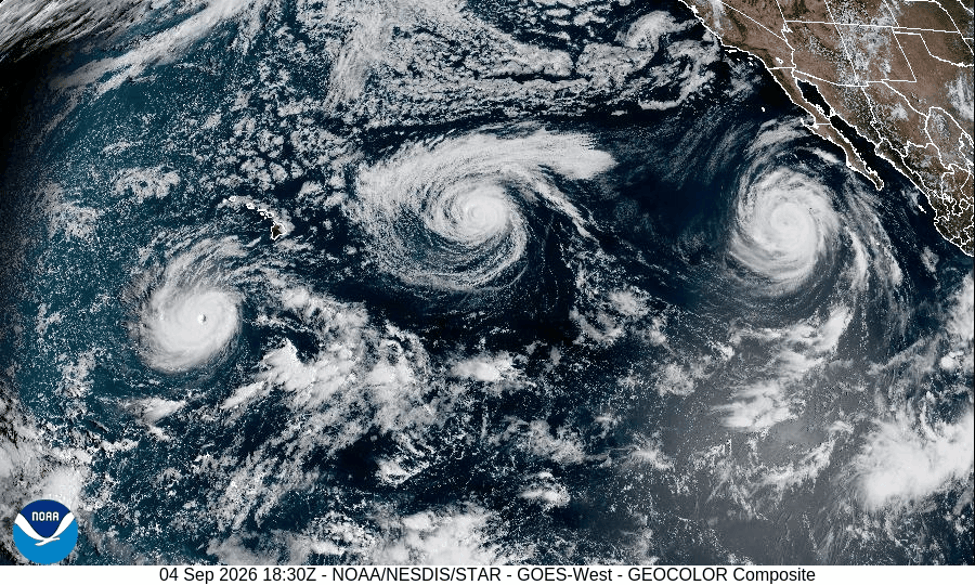
ENSO is measured by ocean surface temperatures near the equator. But these storms are supported by warmer ocean temperatures much farther north.
But since then, things have grown quieter. We’ll see what happens when things cools down.
Warming that supports tropical activity like this may be ENSO related, but that’s short-term. What’s really going on with land surface temperatures? I apologize for my north American centrism.
I think most of us have an understanding that things have warmed, but by how much?
You can look up the data yourself, in a friendly data portal located at:
Climate at a Glance | National Centers for Environmental Information (NCEI)
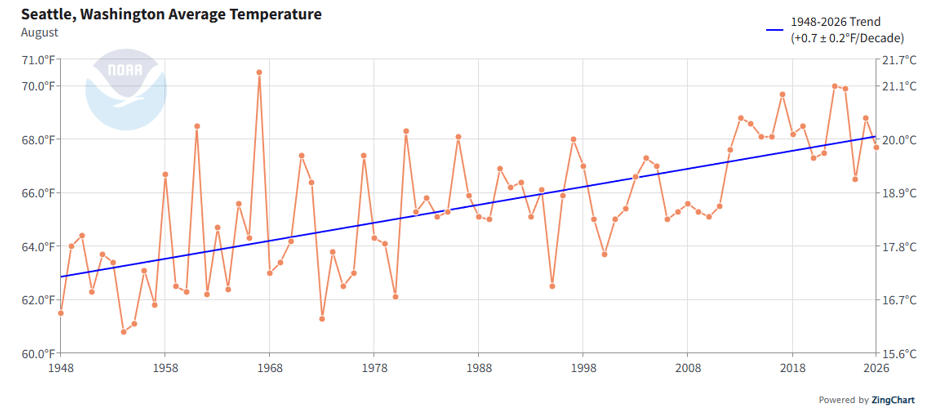
We’ll show a few time series for a handful of cities. They have different baselines, so keep an eye on that.
There’s a larger issue here. The author has this perception that this data has been ignored. It’s safe to say that a lot of people really don’t want to know, especially here in Texas. On the face of it, therefore, this looks like a deliberate situation. So, have a look at the portal and look up the time series of the nearest weather station in your area.
Each time series has a linear trendline. And I know, if you’re really particular you might say, “why fit a line to something that probably isn’t linear?” Well, we really don’t know what shape it will take. And please don’t say it will be exponential, like we’re going to cook in an oven that just keeps getting hotter and hotter. The reality is that it will likely become exponential, but the kind of exponential curve that flattens out.
In any case, there are real thermally positive (meaning: bad) feedback effects that we expect to see, and may be starting to see, like albedo reduction from ice loss.
Here are some plots, binned by month, from the above portal.
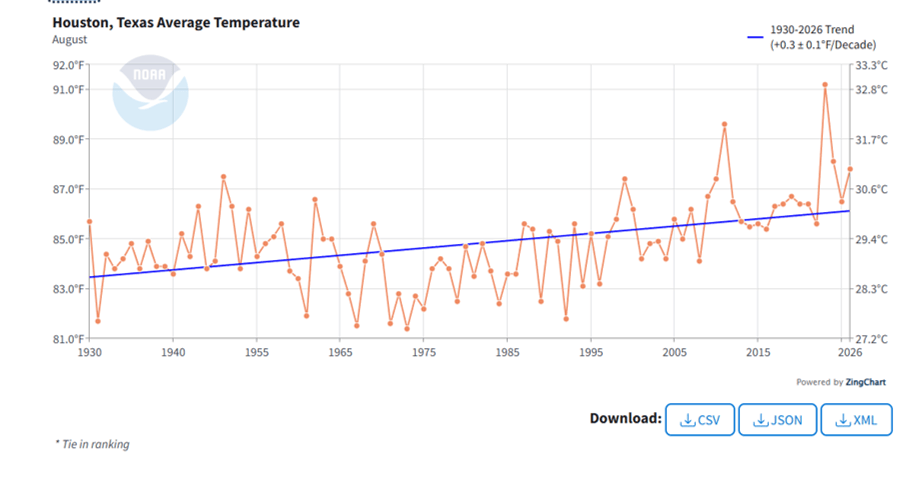
Houston is likely buffered somewhat by the onshore flow from the Gulf of Mexico. Houston is about 2 degrees warmer than the 1970s baseline, and the Gulf of Mexico is also about 2 degrees warmer than the baseline.
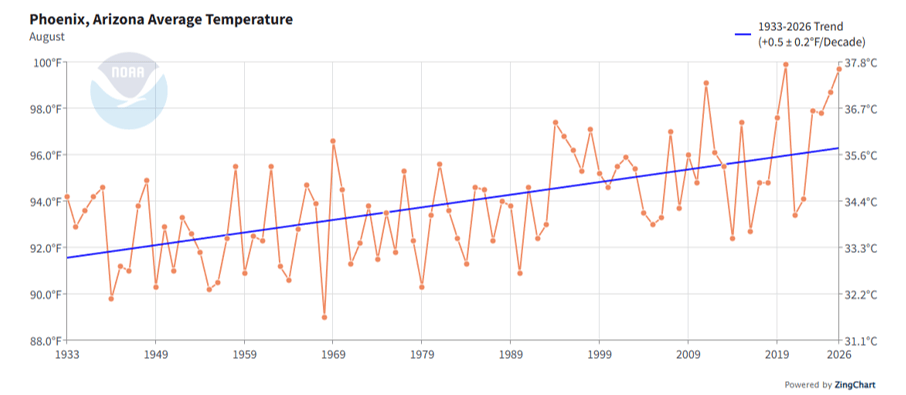
Could Arizona harbor more inhospitable desert than it already has? The answer is yes, it can, and will.
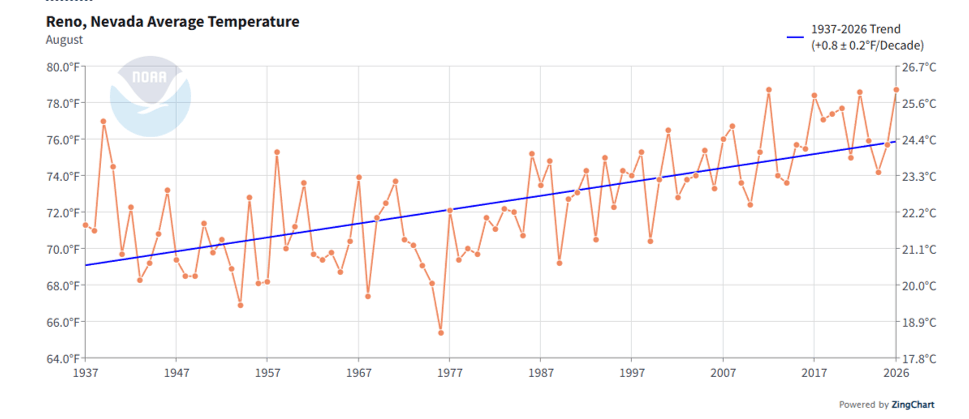
The increase in Reno’s temperatures has been widely discussed by local and even national media, as Reno has the dubious distinction of being the most rapidly warming American city.
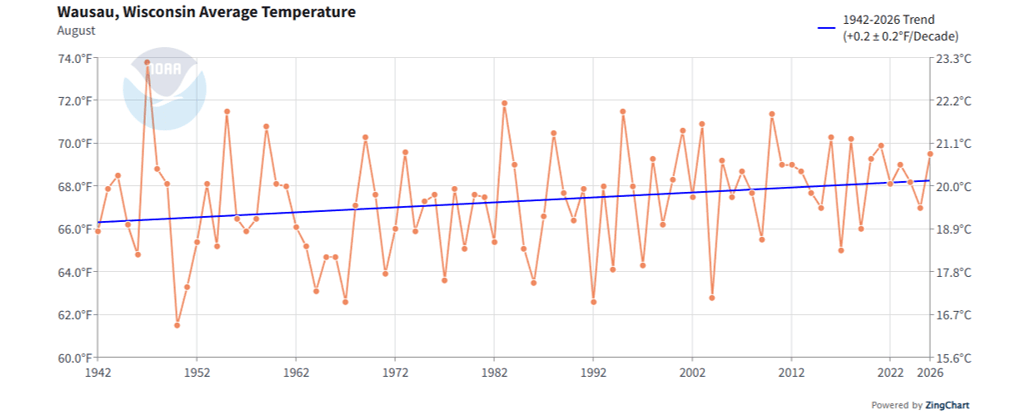
Hometown Wausau, Wisconsin looks oddly flat. It’s at 45 degrees north with a cold continental climate and short warm summer. Usually far enough north to have weather dominated by the jet stream, its climate seems somewhat protected.
Those night time minimum average temperatures are especially worrying, as they translate into more drying and lower soil moistures. That’s the real driver of ecological change, soil moisture.
Seattle’s mean temperatures, and those others shown in the American West, are part of the mechanisms driving the drying shown in the GRACE/GRACE-FO analysis papers like Chandrapurkhar et al. (2025).
The proof is in the pudding, as they say.
Humans are very adaptable, and it is of some concern that we are the proverbial frog in the warming pot. Adaptability is good, in principle, but Americans these days are strained by their adaptability. Those that bear the difficult burden of a corporate job, by which they benefit materially, and those who do not. Stress and strain, engineering principles.
Here’s Reno’s minimum average temperature.
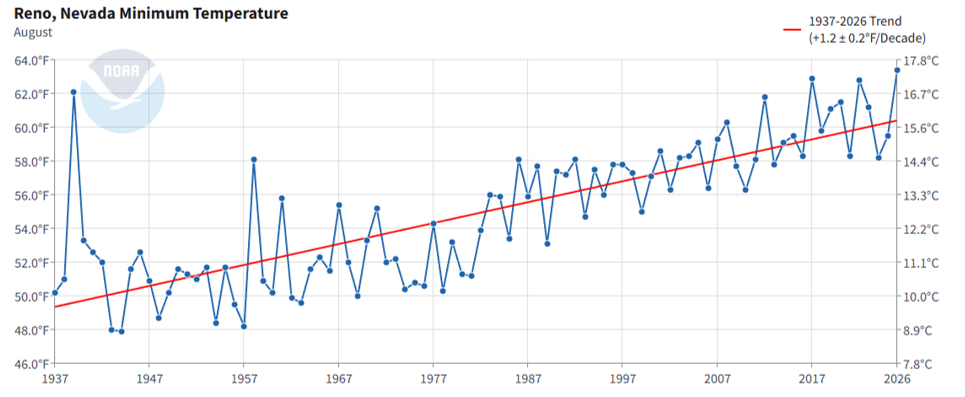
This issue is of greater concern because, while there is broad acknowledgement that warming has already occurred, these time series have received relatively little attention. This is unfortunate, as they show what we are experiencing is not just qualitative, but very well-described quantitatively.
Here’s an anecdotal aside, a qualitative observation of warming.
Concrete expands and contracts with the temperature, so this must be accounted for with expansion joints, those straight cracks that allow for this. The formula for expansion joint separation is quite simple, and relies principally on the average temperature change:
W=L×α×ΔT
Where:
= required joint width (inches or mm)
= distance between joints (slab length, in consistent units)
= coefficient of thermal expansion of concrete (typically
/°F or
/°C, though this varies with aggregate type)
= maximum expected temperature change (°F or °C)
In the Houston area after a very hot summer, this summer, there have been an unusually high number of curbs expanding, cracking, and coming to rest jutting out into city streets, or just lying in crumbled blocks on the shoulder. It’s not normally uncommon, but this summer there are so many that they are sometimes road hazards.
[picture]
Is this because the design ΔT has been exceeded? It’s possible, as the Houston heat island effect is strong, there’s a ton of heating going on and very little shaded area in some areas. Concrete surfaces also reflect a lot of light, so scattered irradiation is significant.
Houston’s mean nighttime temperature has increased by about three degrees F, more than the overall mean change. This is partly due to the heat island effect. And certain areas in Houston have been noted to generate their own weather. For instance, the George Bush International Airport (IAH) and vicinity (i.e., Aldine) often create their own thunderstorms.
Here’s a time lapse of one thunderhead that was very persistently staying right over IAH.
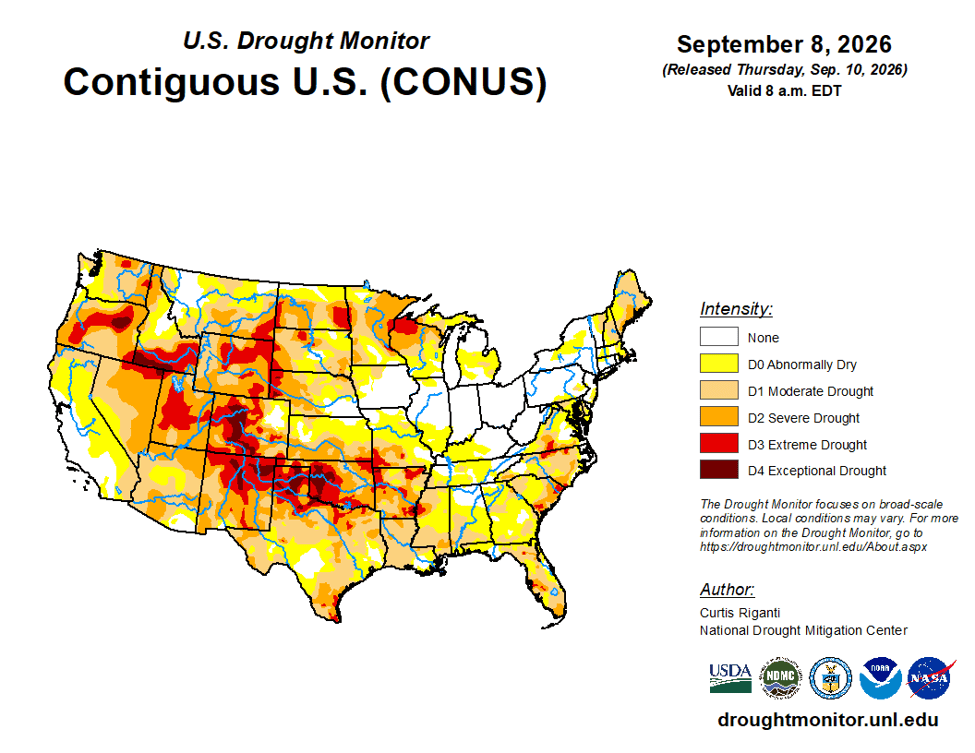
In related news, here’s the current (almost) USA drought situation:
And the current sea surface temperature anomaly map:
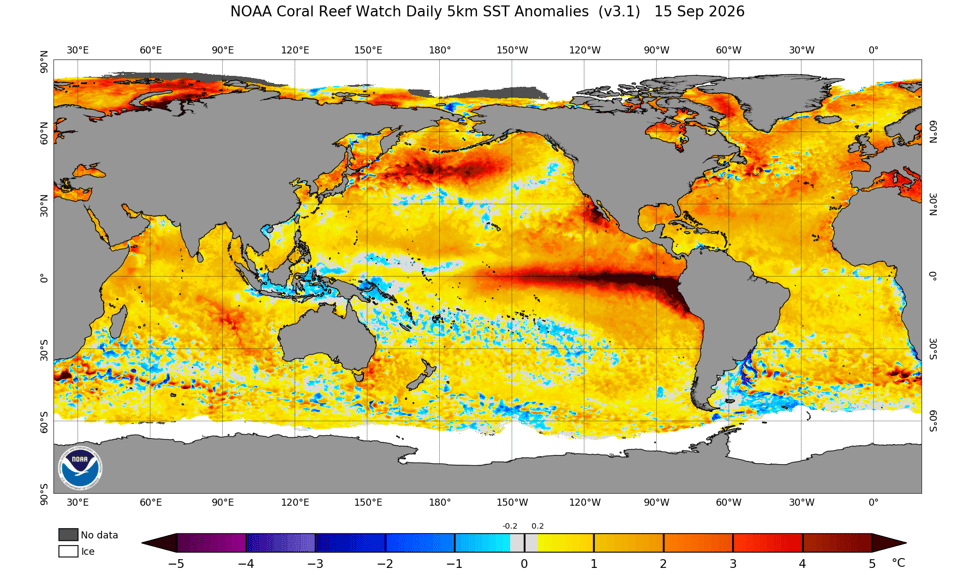
There’s that “super” El Nino and the north pacific blob that’s not supposed to be there, as north Pacific sea surface temperatures are usually anti-correlated with ENSO. It’s worth looking into what dynamics are responsible for this (i.e., Walker Circulation).


Please leave a comment. I will respond.